BioSource dMRV
Streamlined compliance for quicker carbon credit turnarounds
4 hrsreport compiling saved each week
Explore case study
A focused conversation about how your business runs and where AI could help — and where it would not.
Book a free review →The pyrolysis plants measured everything and shared nothing without a daily manual export or a vendor API bill. Now the data arrives on its own, and an AI agent turns it into maintenance schedules, early wear warnings and feedstock-tuned settings.
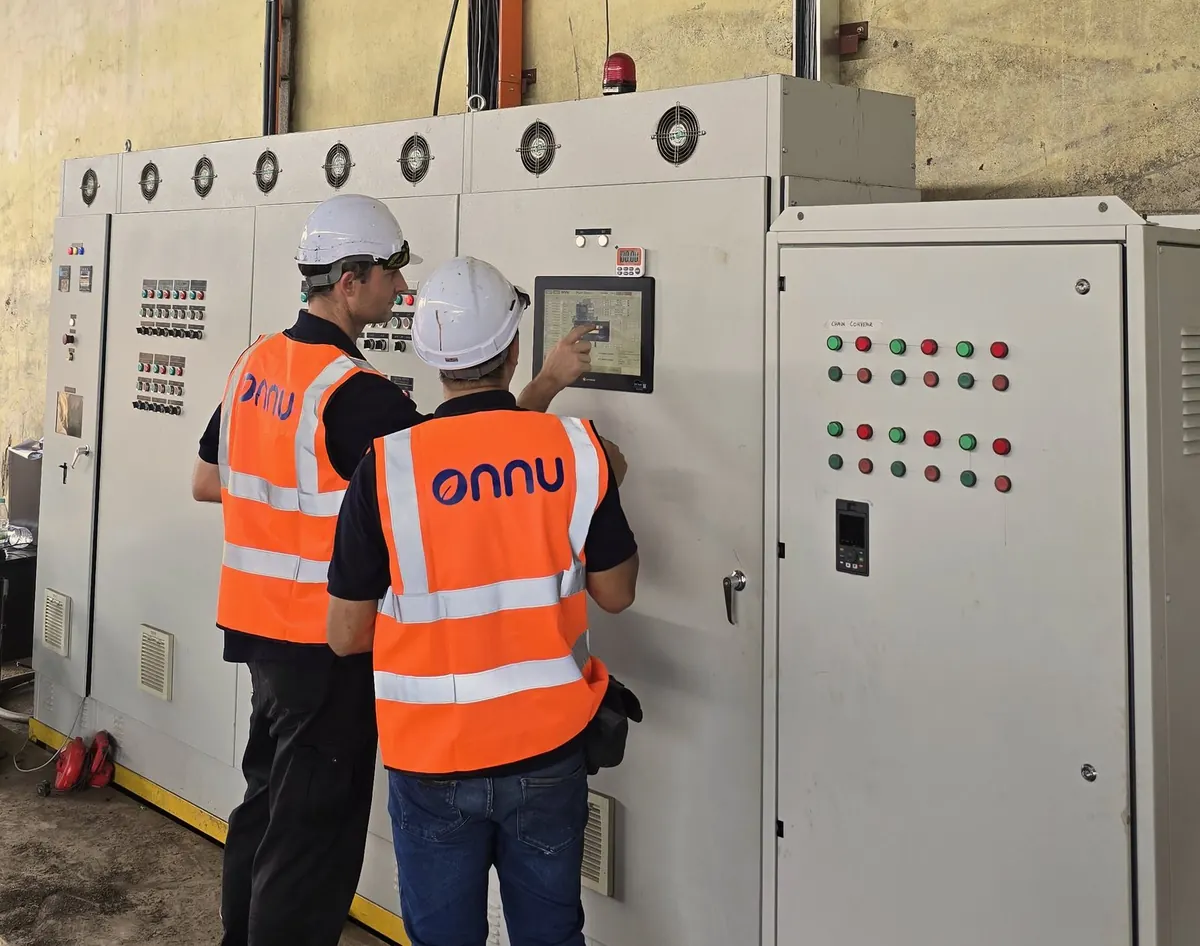
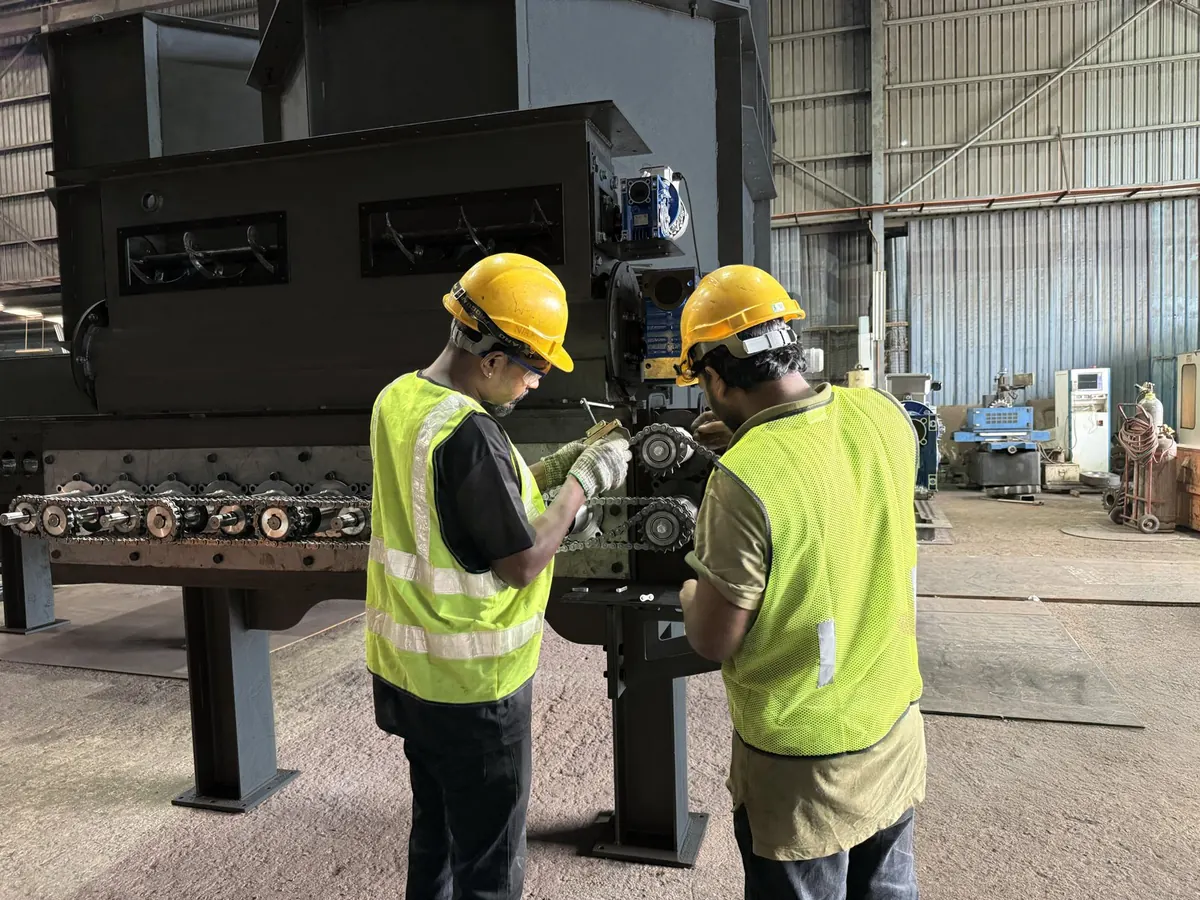
Our client is a biochar project developer running industrial pyrolysis plants, turning oil palm trunk, empty fruit bunches and other biomass into biochar. Every plant was already measuring the things that matter: motor currents, temperatures, feed rates, alarms and trips. Almost none of it reached anyone who could do something with it. There were two ways to get at it. Pay the manufacturer for API access, or send an engineer to the HMI to export it by hand, every day, at every site.
Getting hold of the data was hard. Trusting it once you had it was harder.
Getting data off the plant meant an engineer standing at the HMI, exporting it by hand, every day. That was about an hour a day. It only covered the sites someone actually visited, and it stopped completely when that person was away.
The vendor did offer a way in: a paid API. That meant a recurring bill, for every site, to read numbers the client's own plant was already producing.
The plants run on more than one brand of PLC, a Siemens on one machine and a Unitronics on another, each with its own tag naming. On top of that, the live sensor tags and the equipment parts catalogue were separate systems that did not share identifiers. Nothing matched up on its own, so every reading had to be reconciled by hand before it could be compared across machines.
Partway through, the vendor changed what the sensors measure. One combined current reading per auger drive became two separate sub-motor readings. Four new channels also turned up with the wrong unit recorded against them. The values were right; anything built on the label was not. Mix any of that together and the baseline is wrong before it exists.
AI reads the sensor and equipment manuals and builds the schedule out of them, instead of someone typing intervals in by hand. Overdue work, jobs due this week and jobs due this month are counted at the top. Every manual stays downloadable so an engineer can check it, and completed work is logged against the asset.
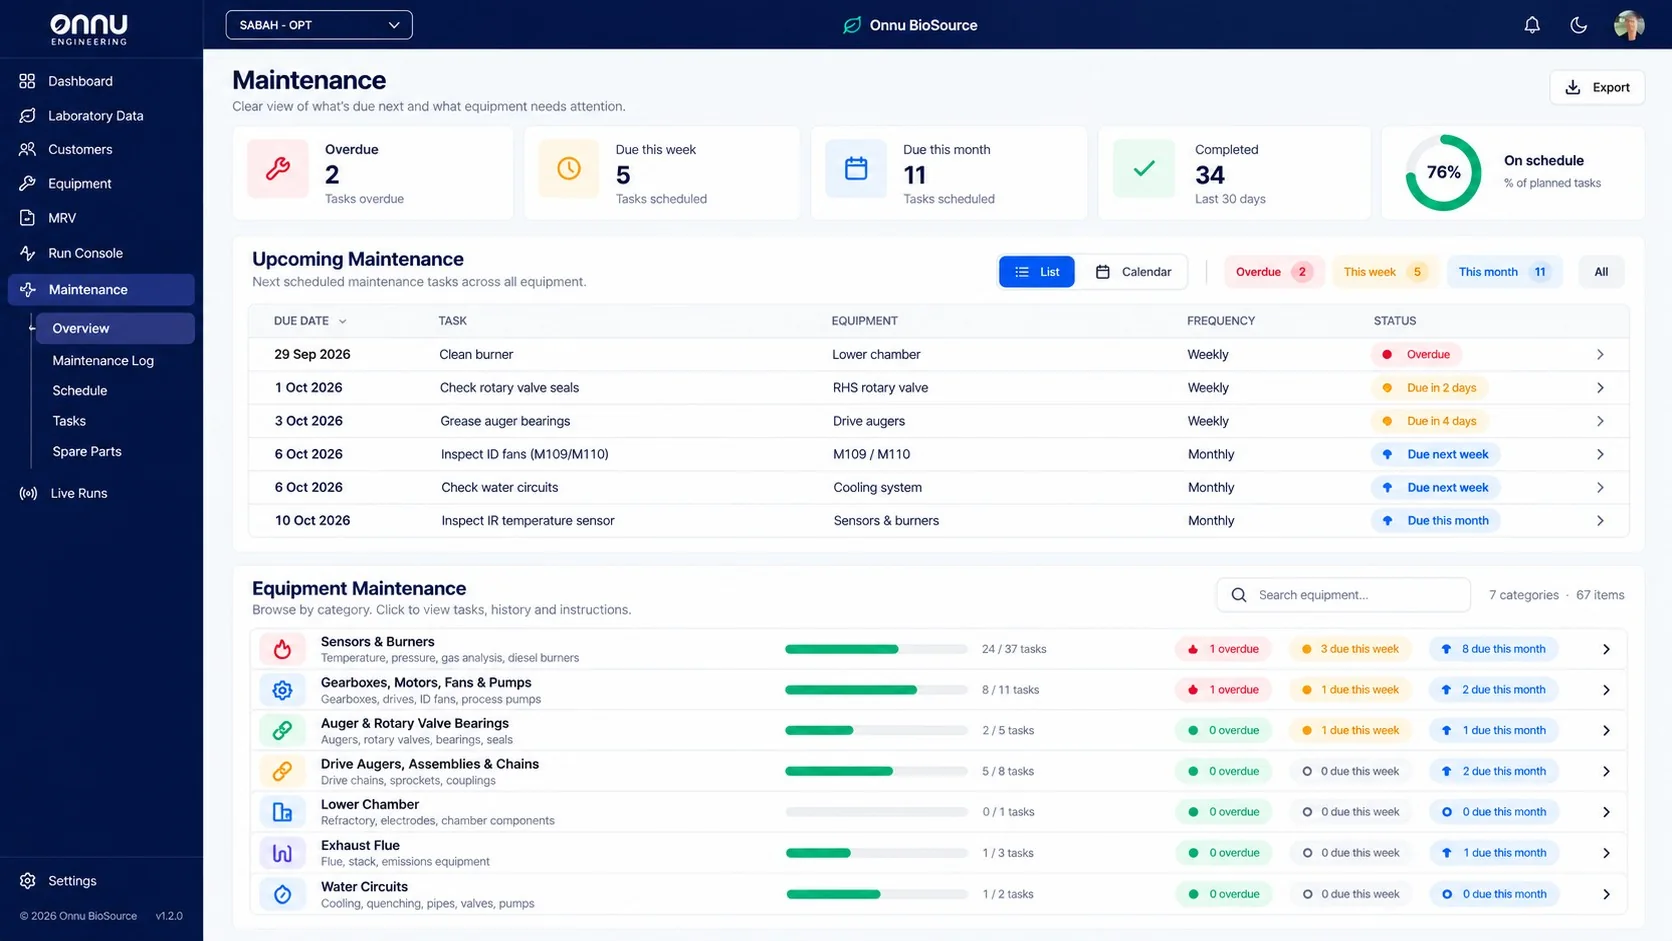
Two jobs overdue, five due this week and 76% of planned tasks on schedule, at a glance.
Temperatures, auger currents and fan speeds come off the controllers on their own and stack onto one chart for any run, with alarms and phases marked against them. Nothing to export, nothing to reconcile. The readings arrive already attached to the equipment they came from.
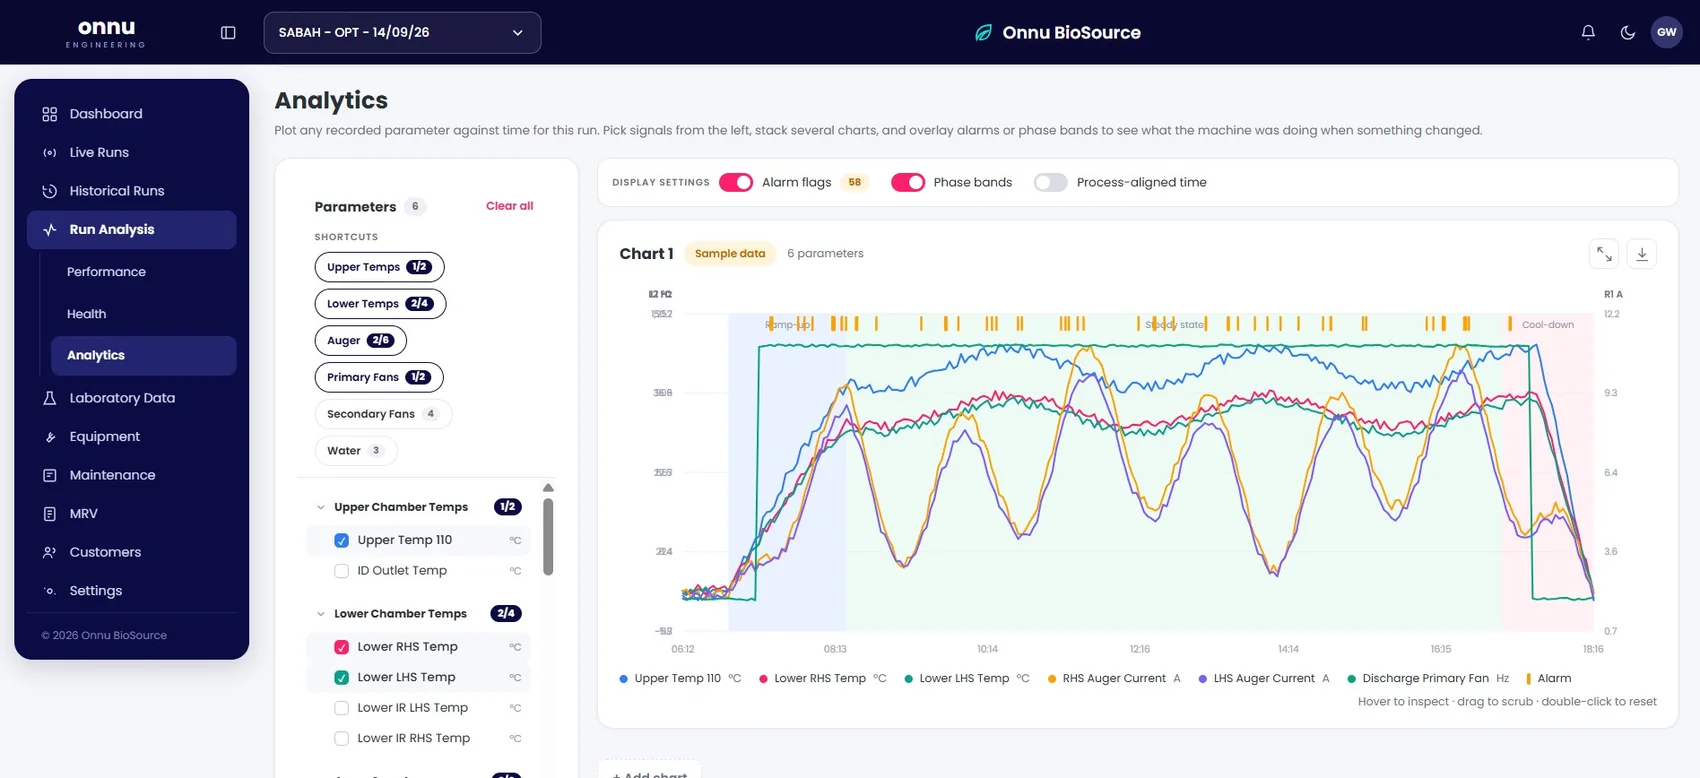
Six parameters and 58 alarm flags across a twelve-hour run, on one timeline.
Each run reads in the order material moves through the machine: feedstock, moisture, input, output. Those figures are weighed against feed rate, and the platform suggests settings for the material actually being run, covering feed rate, auger speeds and fan speeds. It shows its reasoning, so an engineer can judge it.
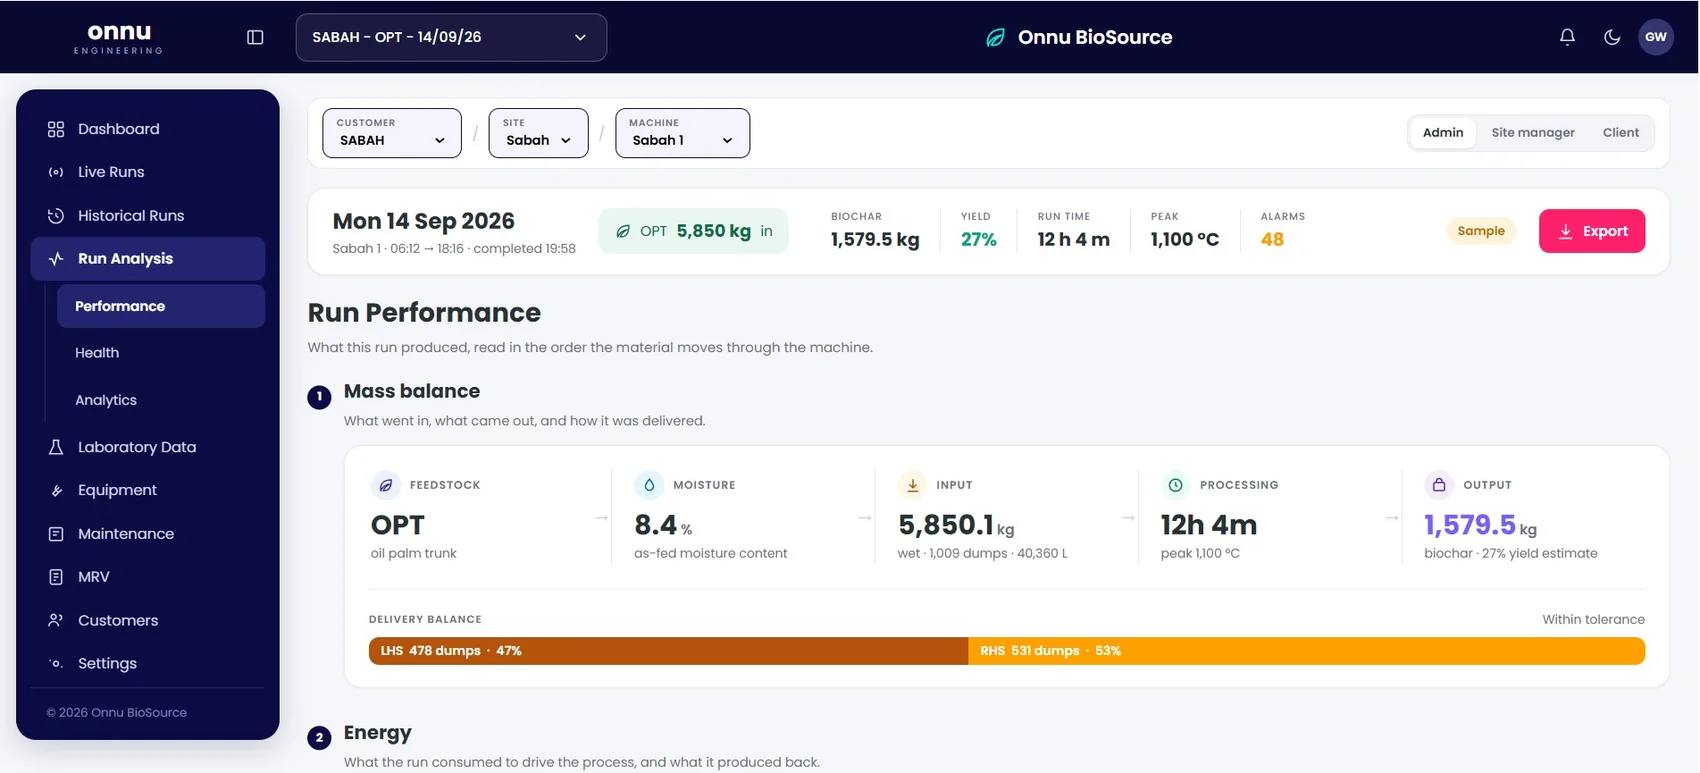
5,850 kg of oil palm trunk in, 1,579.5 kg of biochar out, in a run of just over 12 hours.
On every run, each motor’s reverses, trips and current draw sit next to its own 90-day average. Anything working harder than it should gets flagged while there is still time to do something about it, which turns wear into a planned job instead of an unplanned stop.
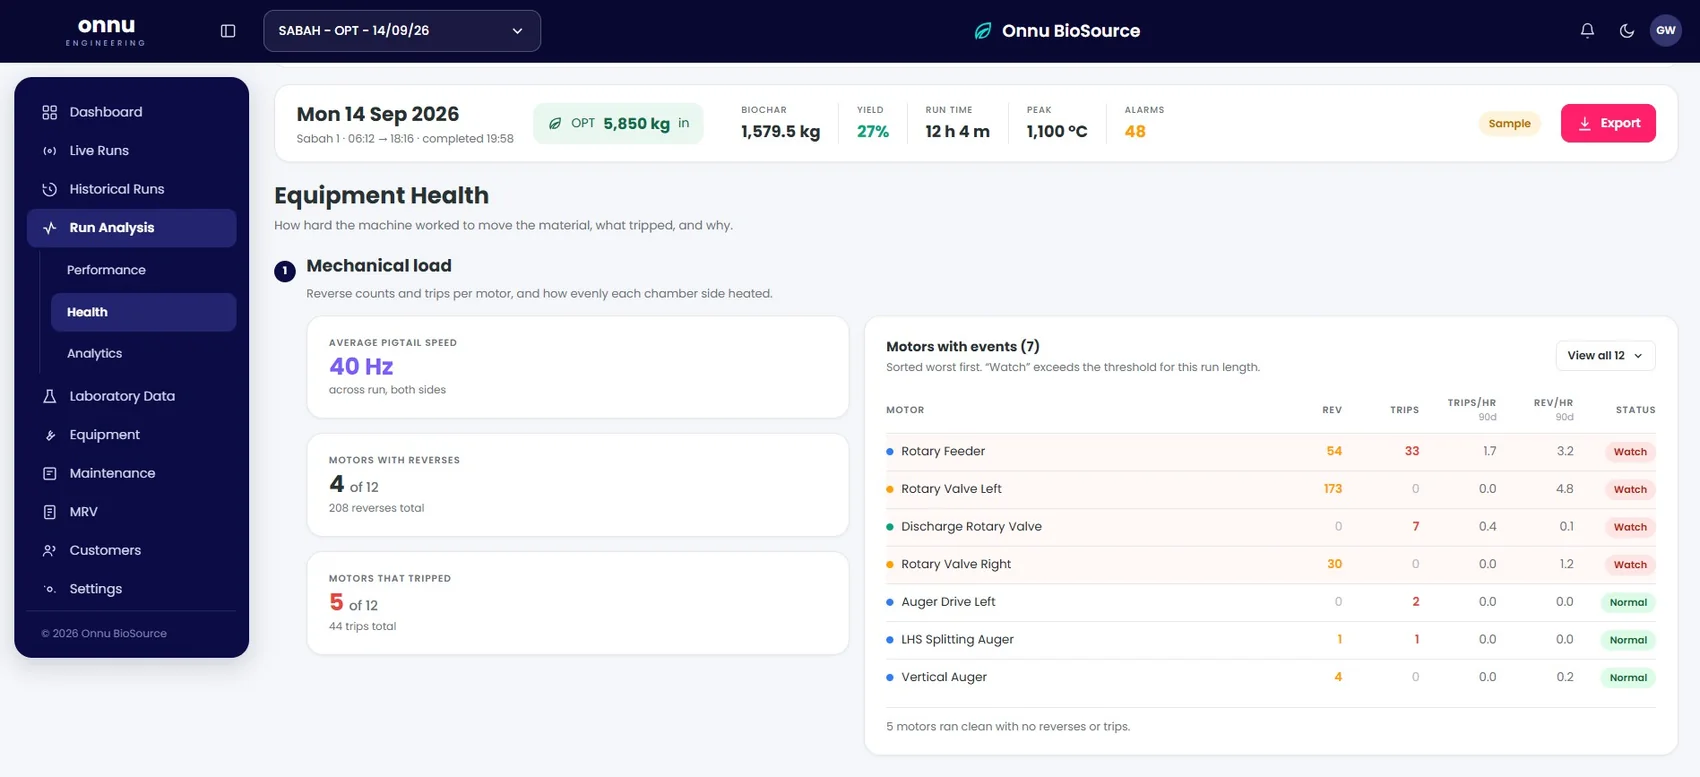
Four of twelve motors flagged Watch, sorted worst first so attention goes where it is needed.
Every reading now arrives on its own and lands in one database. The effort that used to go into collecting it goes into using it:
Tell us about the process or manual check that is slowing you down. We will tell you plainly whether AI is the right answer.
Get in touch

A focused conversation about how your business runs and where AI could help — and where it would not.